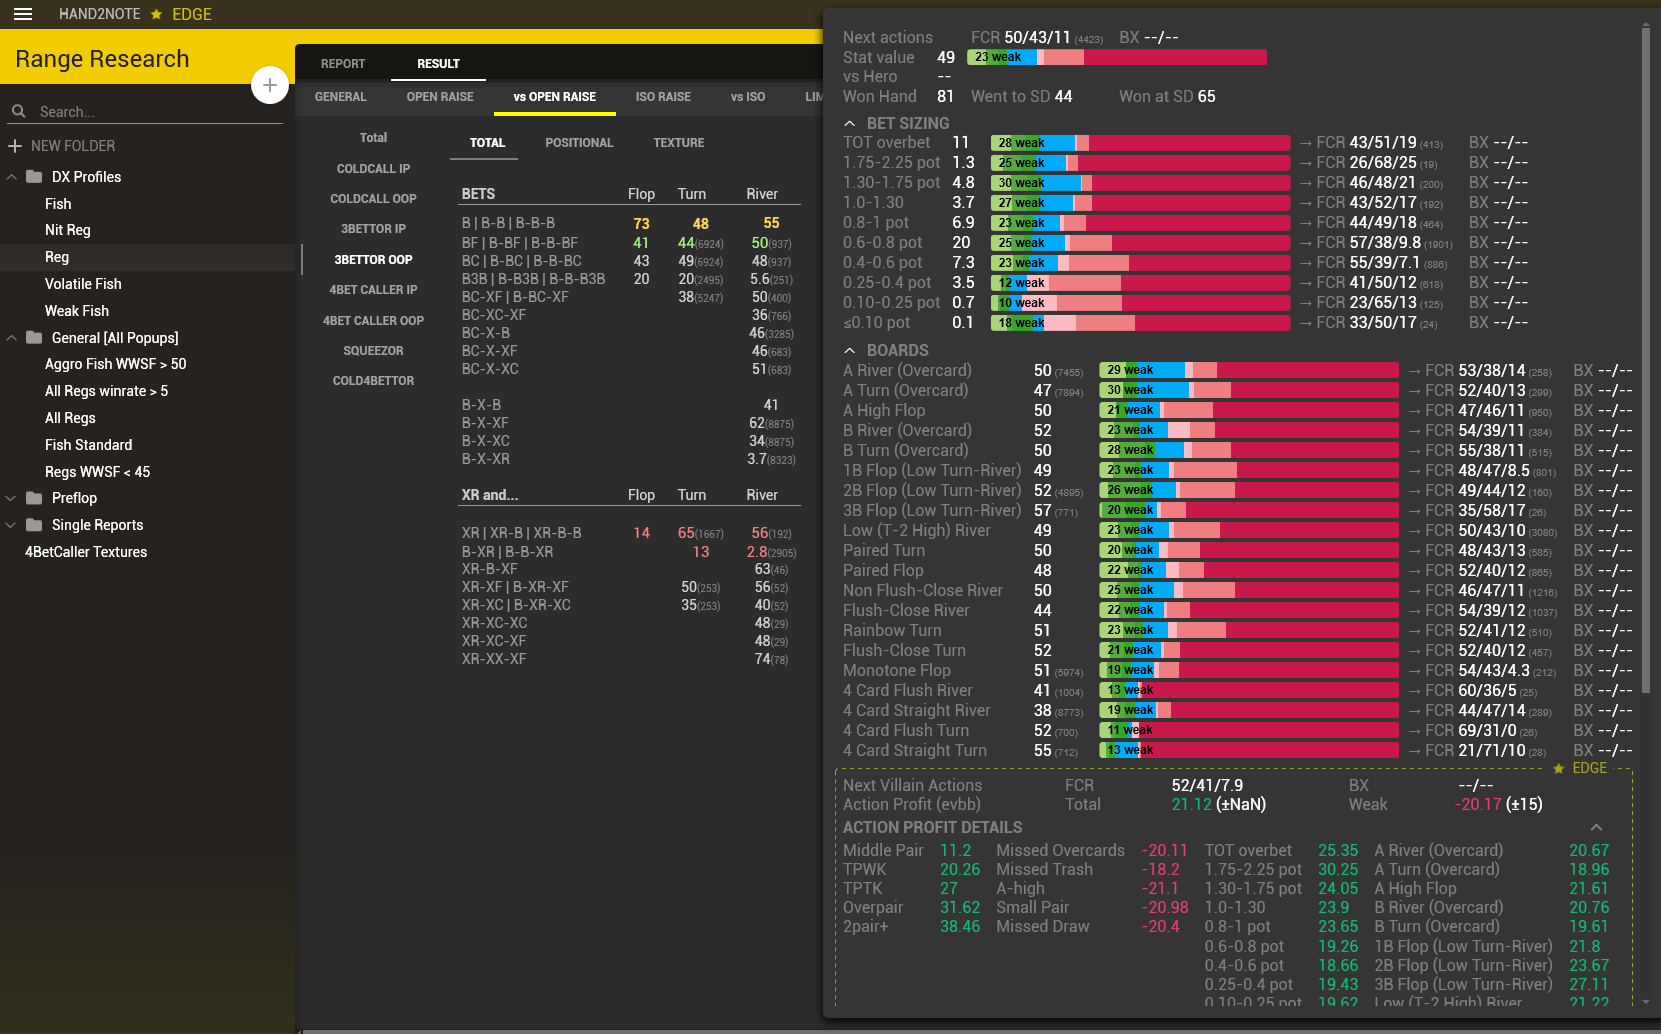
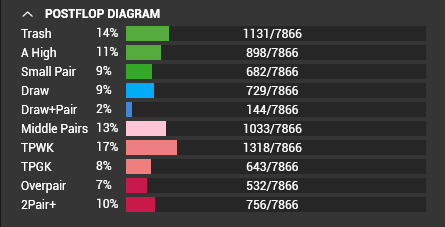
# Postflop Diagram
### In postflop diagrams, you will see % of weak hands on every stat.
{% hint style="info" %}
The black font over the range composition bar which says, "34 weak," is the bluffing frequency. This means regs bluffed 34% of the time on average in this line. Note: in most river bet lines, a bluff is considered third pair (low pair) or worse
{% endhint %}
### Postflop diagrams has 3 different color tones, and each of them represents a different hand strenght
#### **GREEN**
Represents weak hands such as Trash, A High and Small pairs. Also Missed trash and missed overcards for river stats.
#### BLUE
Contains draws and draws + pair: Gutshots; OESD; Flush draws. Green and blue colors are considered as weak.
#### RED
There are different tonalities for red color, because it represents hands from middle pairs, top pairs to overpairs and 2pair or better. You can see the full postflop diagram colorised: